The sticker price of natural gas electricity is only a fraction of its true cost — when hidden health damages, methane leaks, infrastructure failures, and climate impacts are added to the equation, natural gas electricity is far more expensive and dangerous than the bill on your counter suggests. Emerging solutions like the Black Box Perpetual system offer a path to genuinely stable, always-on, clean-energy pricing — without the hidden burdens.
The Illusion of “Cheap” Natural Gas Power
Natural gas has long been marketed as the affordable, cleaner backbone of America’s power grid. And on the surface, it dominates: natural gas accounted for 40% of all U.S. electricity generation in 2025, down slightly from 42% in 2024 but still by far the single largest source of power in the country. With the grid producing a record 4.43 terawatt hours (TWh) of electricity in 2025 — the highest in history — natural gas is at the center of nearly every conversation about energy costs.
But what does “natural gas electricity cost” really mean for consumers? The number on your monthly utility bill is only one layer. When you peel back the surface, you find a complex web of rising fuel costs, hidden health damages, methane leaks, construction delays, and grid vulnerabilities — all of which you pay for, just not always in the obvious way.
Must See Also: EIA: U.S. Sets New Record for Net Power Generation in 2025

The Sticker Price Is Already Skyrocketing

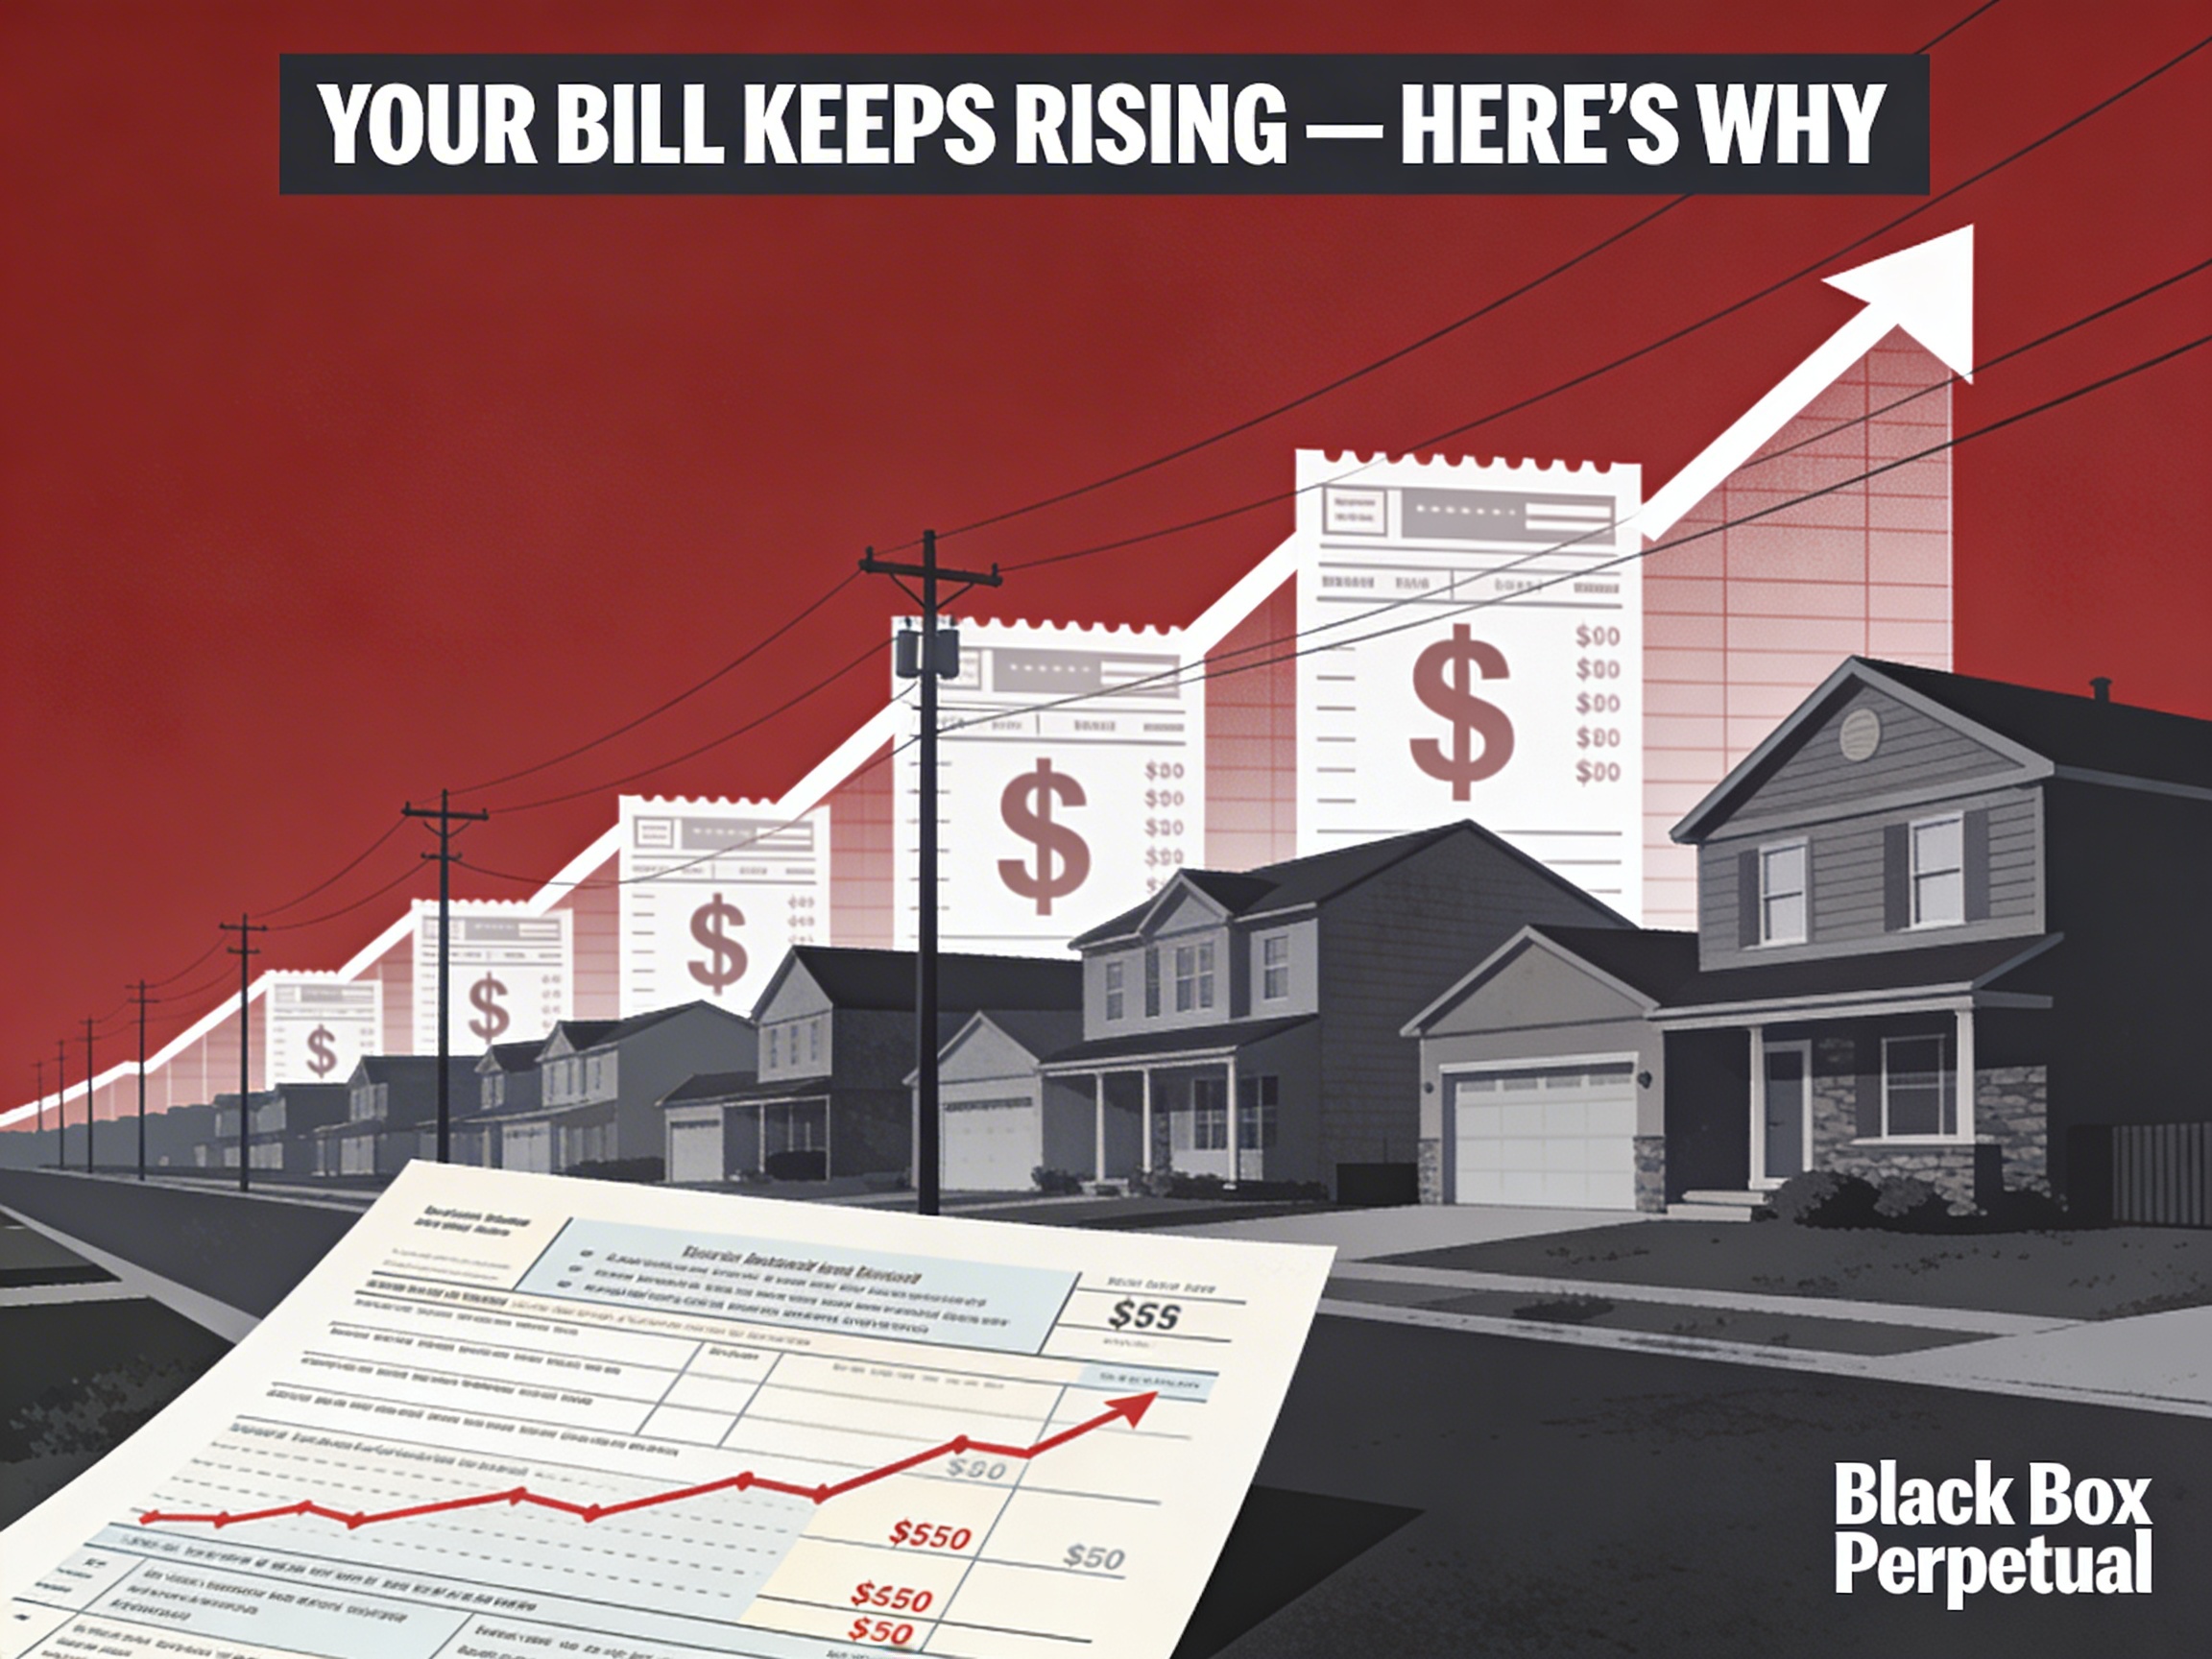
Before we get to the hidden costs, consider how rapidly even the official, visible cost of natural gas electricity has been rising. The average residential price of electricity rose 5.5% in November 2025 compared to the same month in 2024, reaching 17.78 cents per kilowatt-hour (kWh). On a national basis, electricity rates rose 6.8% year-over-year. And since 2020, residential electricity rates have climbed 36%, making electricity one of the fastest-growing household expenses in the country.
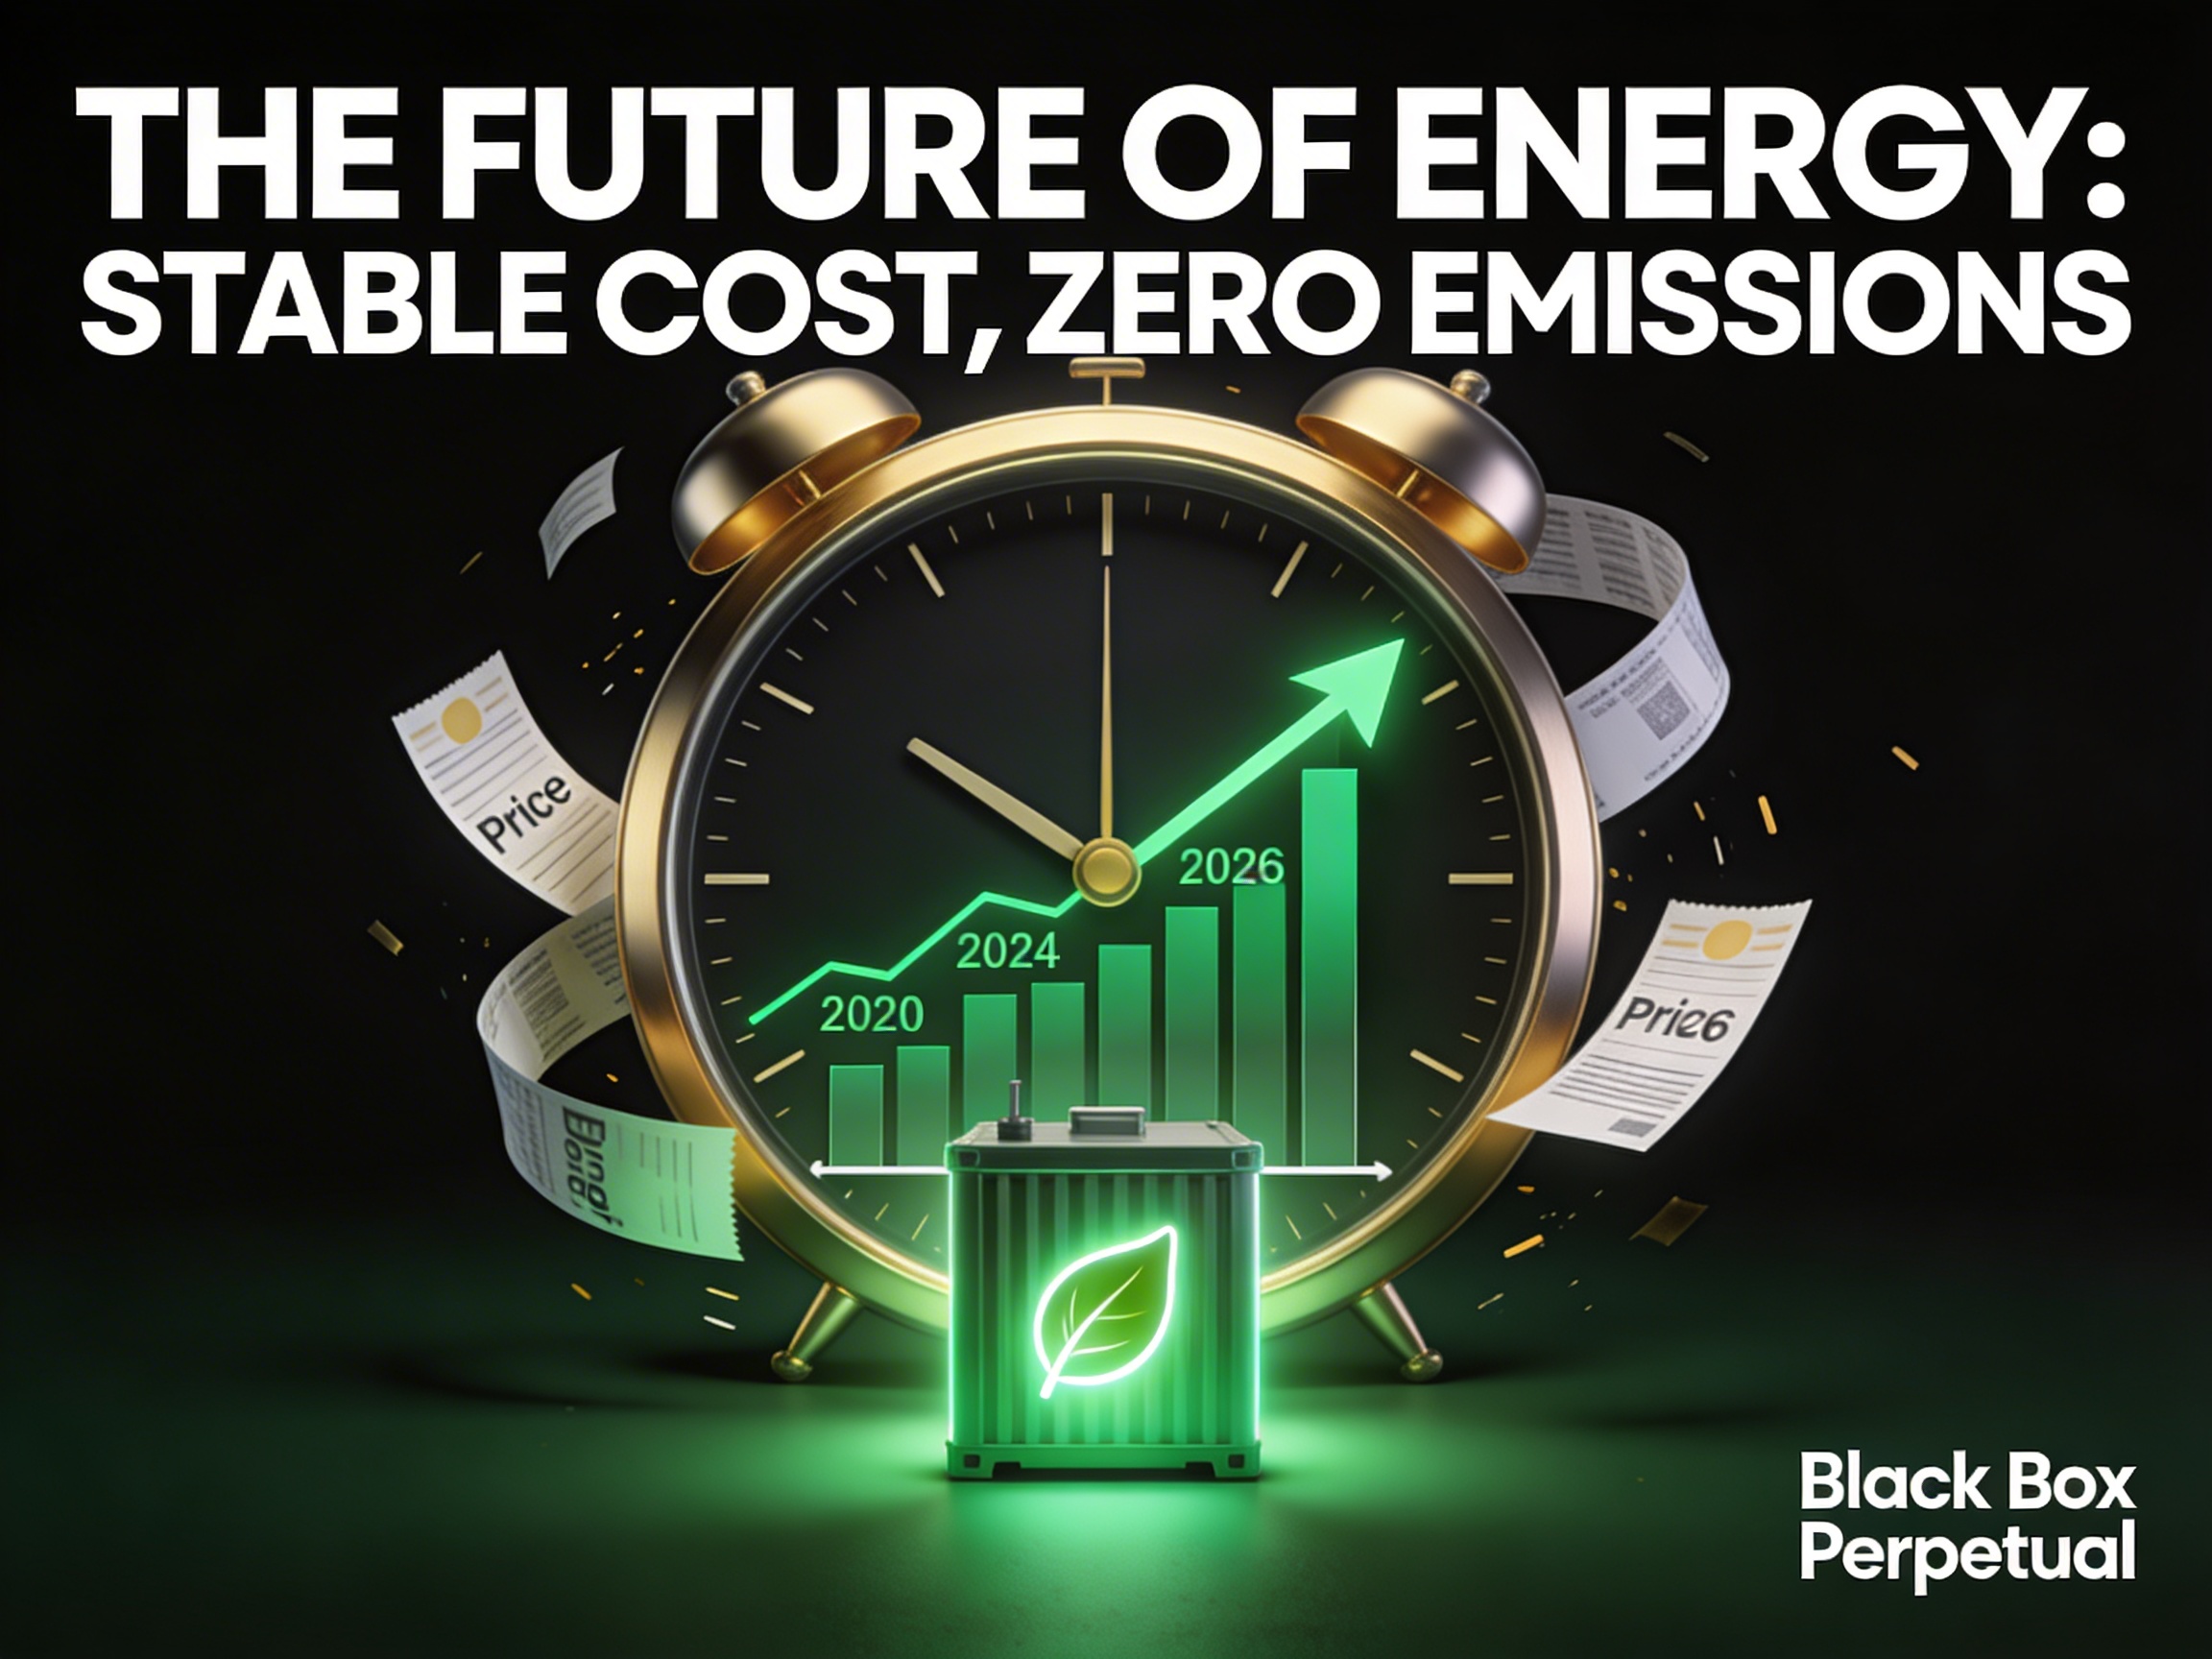
The driver is natural gas pricing. Benchmark Henry Hub spot prices averaged $3.52 per million British thermal units (MMBtu) in 2025 — 56% more than in 2024. Looking ahead, wholesale electricity is projected at $51 per MWh in 2026, up from $47 in 2025 and $38 in 2024. Natural gas prices in 2026 are forecast to average $4.80 per MMBtu — driven by export growth, production constraints, and growing domestic competition from data centers, EVs, and electrification. Because natural gas sets the marginal price of electricity during most hours in most regional markets, every spike in gas prices becomes a spike in your power bill.
Must See Also: Gas, Electricity Prices Spiked Year Over Year in November — Utility Dive
The Hidden Health Cost: $120 Billion and Counting

The number most Americans never see is the health damage bill. A landmark study by the National Academies of Sciences estimated that $120 billion in hidden costs were incurred in the U.S. in 2005 alone from the health effects of energy production — costs not reflected in market prices of fuels or electricity. These are what economists call “external costs” — premature deaths, respiratory illness, and crop damage caused by sulfur dioxide, nitrogen oxides, and particulate matter from burning fossil fuels.
For natural gas specifically, non-climate damages from plants accounting for 71% of electricity generated from natural gas totaled about $740 million in 2005, or 0.16 cents per kWh. That may sound small, but climate-related damages add between 1 and 3 cents per kWh at moderate carbon valuations — or as much as 5 cents per kWh at the higher end. The Rocky Mountain Institute (RMI) estimates that implementing clean energy portfolios instead of proposed gas plants could avoid $23–$74 billion in health impacts while actually lowering energy bills over a 20-year period.
These are not abstract numbers. They materialize as asthma attacks, heart disease, and shortened lives — disproportionately in low-income communities and communities of color located near power plants. About 60% of the health impacts from proposed gas plant emissions would fall in low-income communities and communities of color, RMI found.
Must See Also: The Hidden Health Costs of Gas-Fired Power Plants — Rocky Mountain Institute
Methane: The Climate Wild Card No One Talks About
Natural gas is primarily methane — and methane doesn’t stay where it’s put. U.S. oil and gas operations emit more than 6 million tons of methane per year, roughly three times the level predicted by the U.S. government, according to Stanford-led research published in Nature. The economic cost of that wasted methane is $1 billion in lost commercial value — rising to $10 billion when broader harm to the economy and human well-being is included.
Why does this matter for electricity costs? Because over a 10-to-20 year timeframe, methane is 80 to 100 times more potent as a greenhouse gas than carbon dioxide. The Environmental Defense Fund estimates that U.S. natural gas pipelines leak between 1.2 million and 2.6 million tons of methane per year — all contributing to climate change that generates future costs in agriculture, infrastructure, and healthcare. RMI has confirmed that methane leakage as low as 0.2% puts natural gas’s climate impact on par with coal.
Leaks don’t just warm the planet — they dirty the air. A 2025 study found that methane pipeline leaks cause fine-particle air pollution concentrations to spike not just locally but in neighboring states, as seen when the 2018 Merrimack Valley pipeline explosion in Massachusetts sent PM2.5 pollution elevations into New Hampshire, Vermont, New York, and Connecticut. Every mile of leaky pipeline is a hidden cost born by communities — not utility companies.
Must See Also: Reality Check: Natural Gas’s True Climate Risk — RMI
Infrastructure: Delays, Overruns, and a Supply Chain in Crisis

The capital side of natural gas electricity cost is equally troubled. Building the infrastructure to generate, transport, and distribute gas-fired electricity is massively expensive — and increasingly plagued by delays. Gas turbine lead times have stretched from 3–4 years to 6–7 years due to supply chain bottlenecks, with U.S. orders exceeding 14 GW in 2024 — the highest since 2001. The interconnection queue for natural gas projects has surged 160% year-over-year, as demand for dispatchable power outpaces available capacity.
Large energy project cost overruns are the norm, not the exception. A broad analysis of global energy infrastructure projects found actual costs of $1.358 trillion against $812 billion budgeted — a 66% cost overrun, with more than three-fifths of all projects exceeding budget. Even natural gas LNG projects are running into trouble: North American LNG projects are experiencing cost overruns and delays, with “high construction costs, schedule uncertainty, and the looming glut” becoming serious impediments to financing. One developer reported $300 million in additional costs due to construction delays and higher labor costs. These costs ultimately flow into rate structures — and back onto your energy bill.
Must See Also: Turbine Trouble: Why Power Projects Are Facing Delays — NRUCFC
Grid Reliability: The Hidden Tax of Outages
Beyond generation and fuel costs, natural gas-dependent electricity creates a massive hidden cost through grid unreliability. The U.S. Department of Energy estimates that power outages cost the American economy $150 billion annually. That staggering figure reflects lost productivity, spoiled inventory, damaged equipment, and idle workers that businesses and consumers absorb every time the grid fails.
The numbers are striking at the business level too. A four-hour power disruption costs the average business $10,000 to $20,000, while a three-day outage can run upwards of $50,000. For large manufacturers, a single hour of downtime can top $5 million — and a single day offline can run into the tens of millions. A 2018 survey found that one in four companies experience a power outage at least once a month. None of these losses appear on your electricity bill — they are simply absorbed as the cost of doing business in a grid that cannot guarantee uninterrupted power.
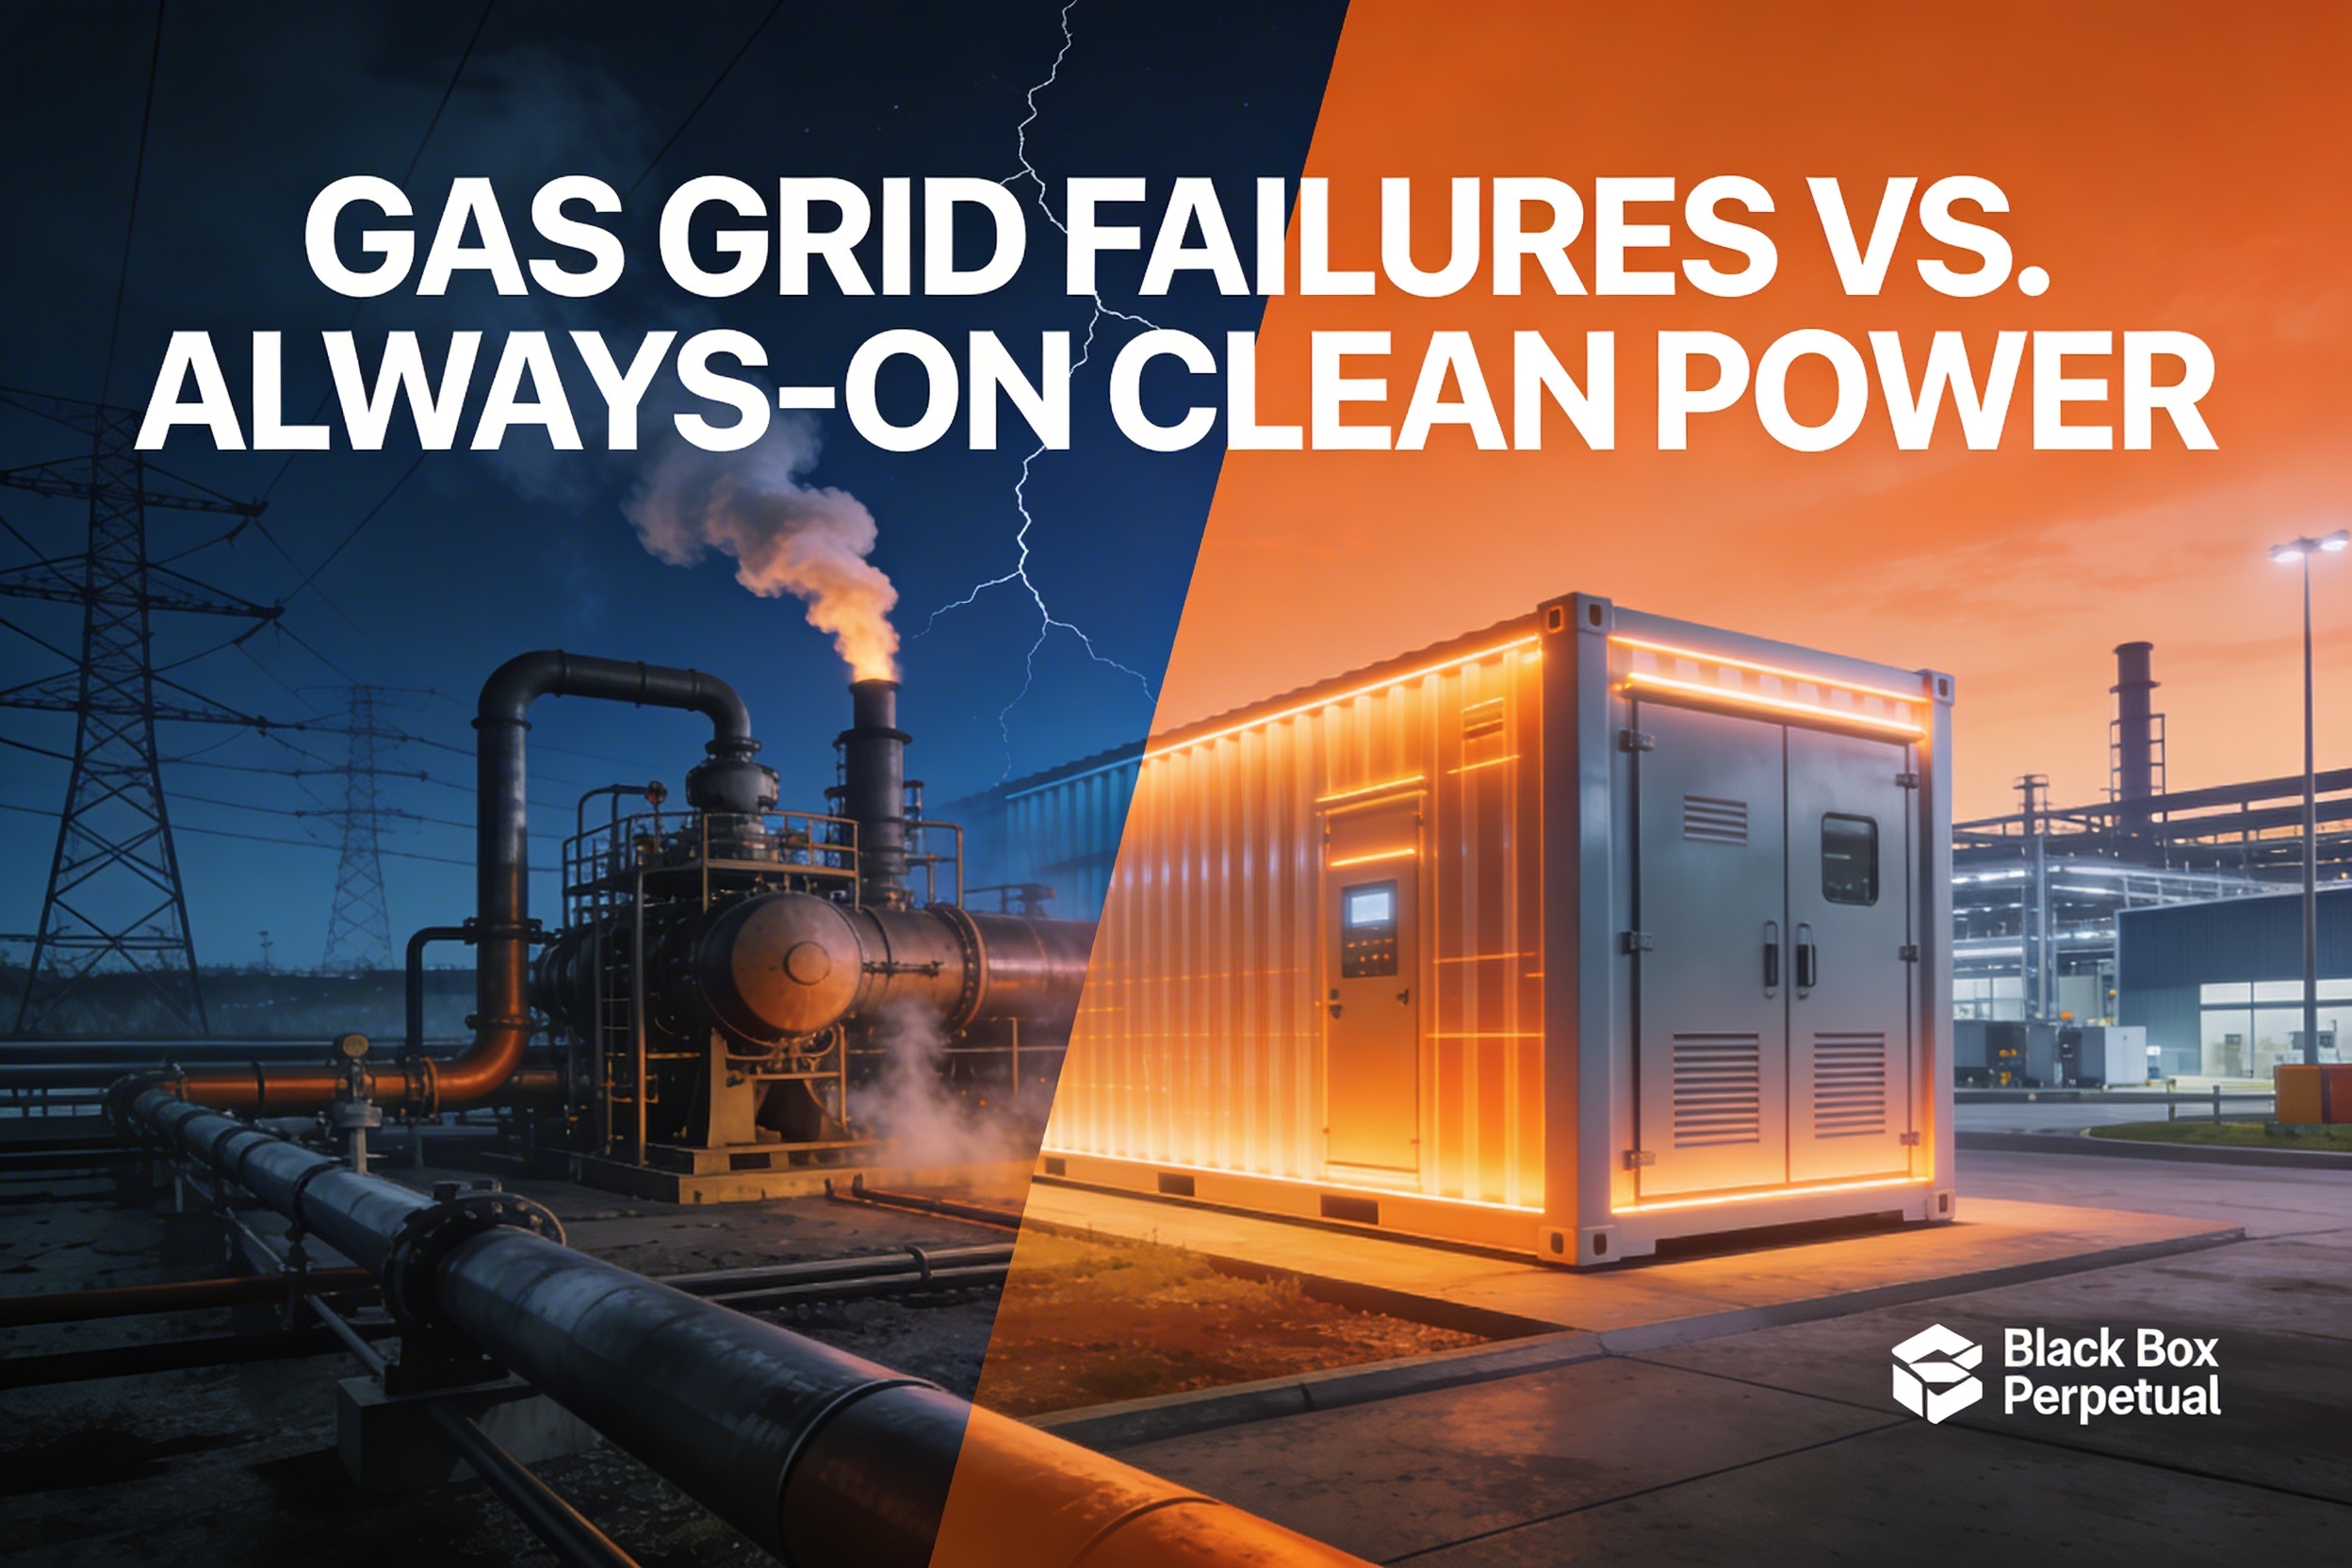
The volatility of natural gas pricing makes this worse. When a cold snap or geopolitical event drives up gas prices, grid operators cut back on generation and rolling blackouts become a real risk — as Texas experienced catastrophically in 2021. Grid managers can’t hedge fuel price spikes in real time, and when natural gas supply constraints hit during peak demand, the grid is the first thing to fracture.
Must See Also: Analysis Shows Power Outages Cost US Electricity Customers Billions — Oak Ridge National Laboratory
The Levelized Cost Deception
Natural gas proponents often cite the Levelized Cost of Electricity (LCOE) to argue for natural gas’s competitiveness. But even on those terms, the picture is unflattering for gas. Gas peaking plants — used to meet peak electricity demand — are the most expensive option of all, with a maximum LCOE of $228 per MWh. Combined-cycle gas plants max out at $108/MWh. By contrast, onshore wind effectively costs $0 per MWh with Inflation Reduction Act subsidies, while solar PV can come in as low as $6 per MWh with subsidies.
But LCOE alone still doesn’t tell the whole story. As the American Academy of Arts and Sciences has noted, each kWh of fossil-fuel-generated electricity carries roughly 5.6 cents per kWh in additional well-being damages — from adverse health impacts (3.4 cents/kWh) and climate change (2.2 cents/kWh) — costs that never appear in LCOE calculations. The Brookings Institution found that the “true social cost” of coal electricity is almost three times the amount on utility bills — and natural gas, while better, follows a similar structural pattern of hidden externalities. Research from peer-reviewed journals quantifies health impacts from fossil fuel electricity ranging from $0.005 to over $1.00 per kWh depending on location, with national average impacts consistently underpriced in the market.
Must See Also: Paying Too Much for Energy? The True Costs of Our Energy Choices — American Academy of Arts and Sciences
Introducing a Fundamentally Different Model: Black Box Perpetual

Given the mounting evidence that natural gas electricity is far more expensive than it appears — rising sticker prices, hidden health costs, methane damages, infrastructure failures, grid outages, and climate liabilities — what does a genuinely better alternative look like?
Black Box Perpetual (BBP) is developing exactly that: a power generation system that delivers continuous, clean energy with greatly reduced costs — no fuel price spikes, no methane leaks, no grid dependence. The flagship BBP system is a 1MW unit containerized in a standard 20-foot shipping container, designed for large enterprises that can’t afford the hidden costs of conventional electricity. Full deployment scales from this modular 1MW unit to multi-gigawatt capacity.
What makes BBP’s model distinctive is the risk-free entry structure. Selected pilot program partners receive and install the system at their site and use the generated power freely for six months. After the trial, partners may return the unit or enter into a 25-year power purchase agreement for a 10MW+ system at greatly reduced pricing compared to current energy costs. BBP describes their offering simply: “Primary Power You Never Lose” — a direct contrast to the unreliable, price-volatile, externality-laden natural gas grid.
For large enterprises struggling with $150 billion in annual outage costs, soaring electricity rates, and the reputational and financial risk of carbon-intensive operations, the BBP model represents an opportunity to lock in long-term cost stability and energy independence. Full-rate production and first deliveries are scheduled for June 2027, with the earliest contract effective date of May 1, 2027. Organizations interested in qualifying for the pilot program can begin the process by completing BBP’s Project Initiation Form at blackboxperpetual.com.
Must See Also: Black Box Perpetual — Always-On Green Power Generation
The Bottom Line: What You’re Really Paying For
The “natural gas electricity cost” conversation in America has been woefully incomplete. The number on your bill is real — but it represents only a fraction of what natural gas power actually costs society. Add up the $120+ billion in annual hidden health damages, the climate costs of 6 million tons of leaked methane per year, the $150 billion in annual business losses from grid outages, the supply chain crises pushing turbine lead times to 6–7 years, the 66% construction cost overruns that flow back into rate structures, and the 56% spike in Henry Hub gas prices in 2025 alone — and the picture is of an energy source that is neither as cheap nor as reliable as advertised.
Since 2020, residential electricity prices have risen 36%. Wholesale power costs are climbing year after year. Natural gas still dominates 40% of the grid — and every percentage point of that dominance comes with hidden costs borne by families, businesses, and communities who never voted to absorb them.
The fundamental question for large energy consumers is no longer whether to keep paying the true cost of natural gas electricity — it is whether there is a better alternative available. Innovations like Black Box Perpetual’s always-on, containerized clean energy system are positioning to answer that question with a definitive yes.